
REAL ESTATE REALITY ZONE
The RE Reality Zone is a quick summary of key real estate market data available for you to get clarity on the market trends without getting lost in the noise of fake news, YouTube clickbait, or data overwhelm.
30 Second Summary
If you only have 30 seconds read this:
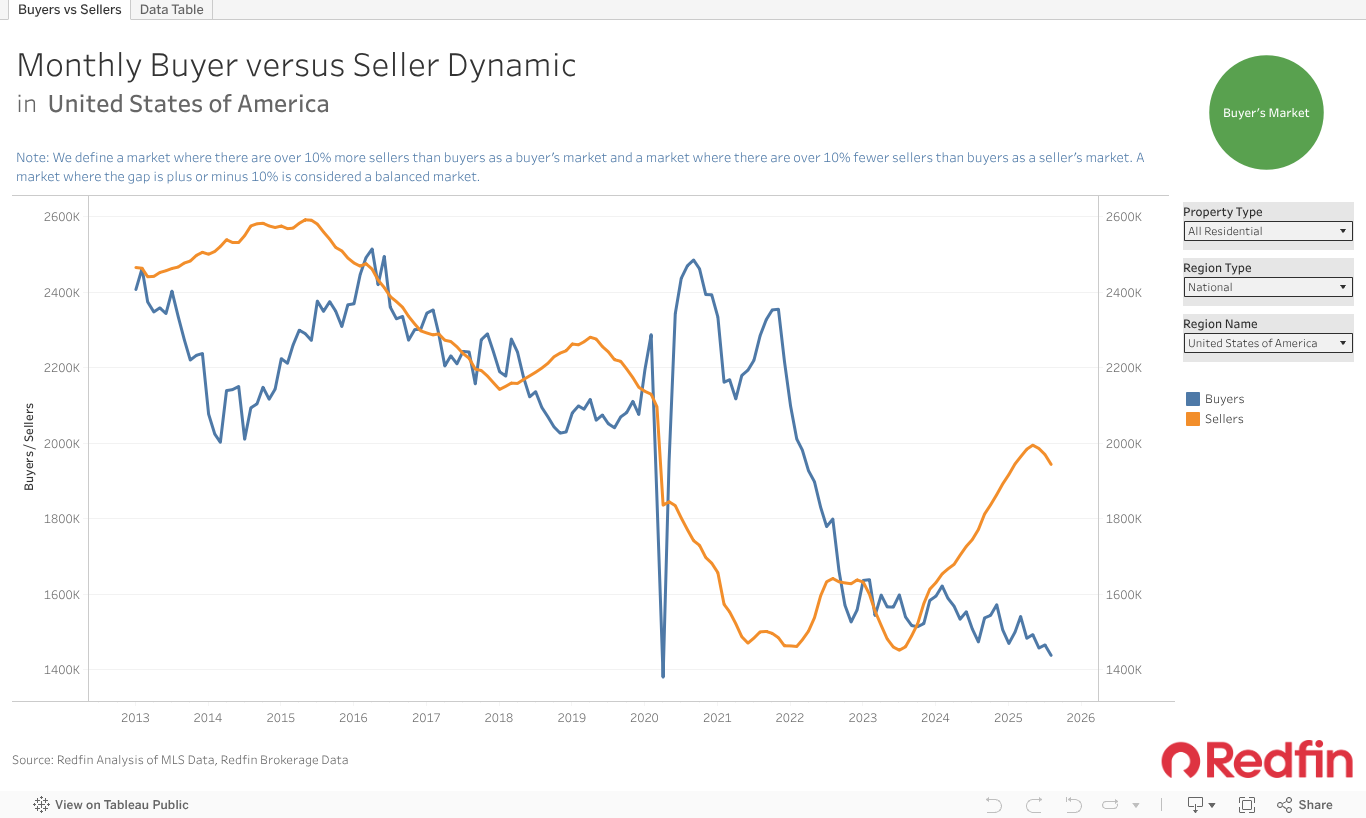
The RE market is fine. Buying activity is stable and normal for this time of year, as is listing activity. Inventory of houses for sale is down, but will pick up as Spring is approaching. Is definitely a Buyers market in most of US.
Interest rates are stable in the 6.0 range as well.
The RE market has essentially stabilized from the pandemic and post pandemic rate change.
Wages are increasing for people to afford current housing. I don’t mean through min wage increase, I mean through job growth by creating demand for products and services, and building more affordable housing with less regulation. “No tax on tips” put hundreds of dollars per month back in the pockets of a lot of people that will help offset their bill/housing, and declared income for mortgages!
See below for the jobs info, lot going on. Not about the “total” right now, it’s about the mix of part time or full time, and citizen or not.
We need more houses. If the illegal immigrant deportation situation changes, that may affect housing availability. No one knows by how much.
Make your purchase and sale decisions based on the fact that sales pace usually declines from here.
Key Stats
If you have 2.5 more minutes see below:
(Stats from from Mike Simonson, Altos, Housingwire, Jason Hartman, and others)
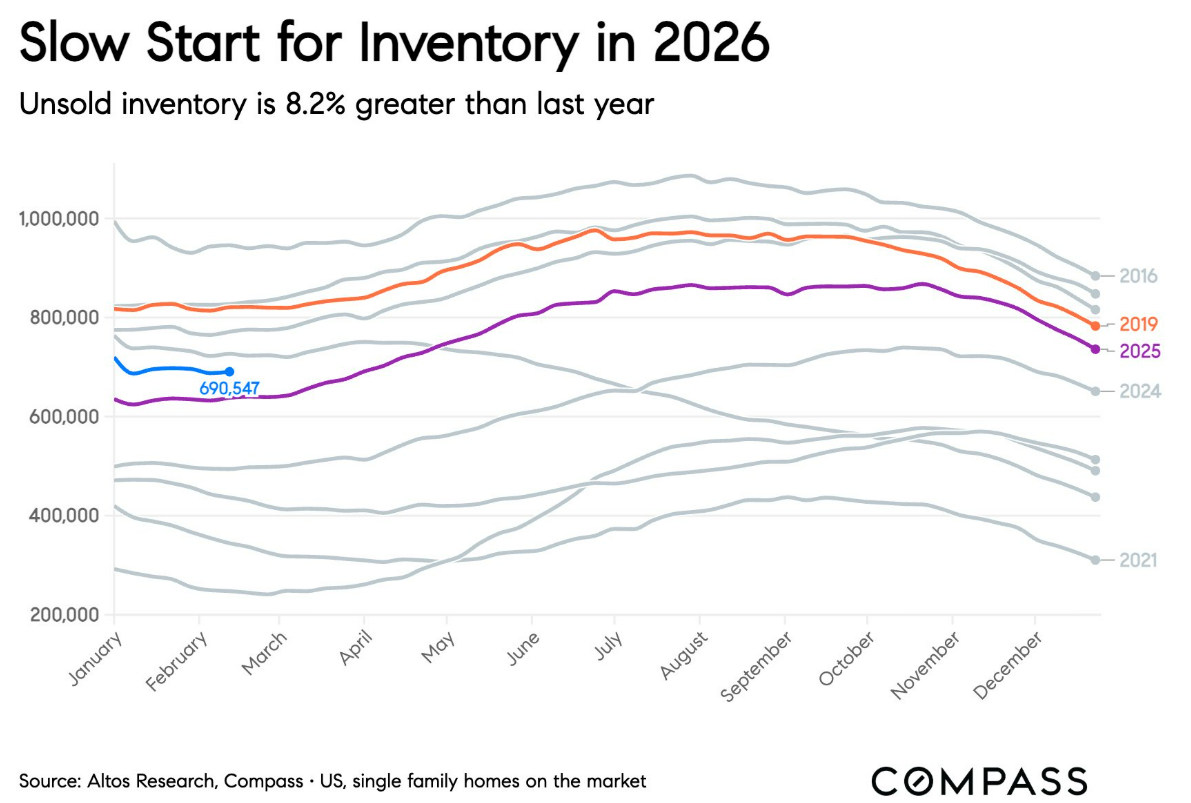
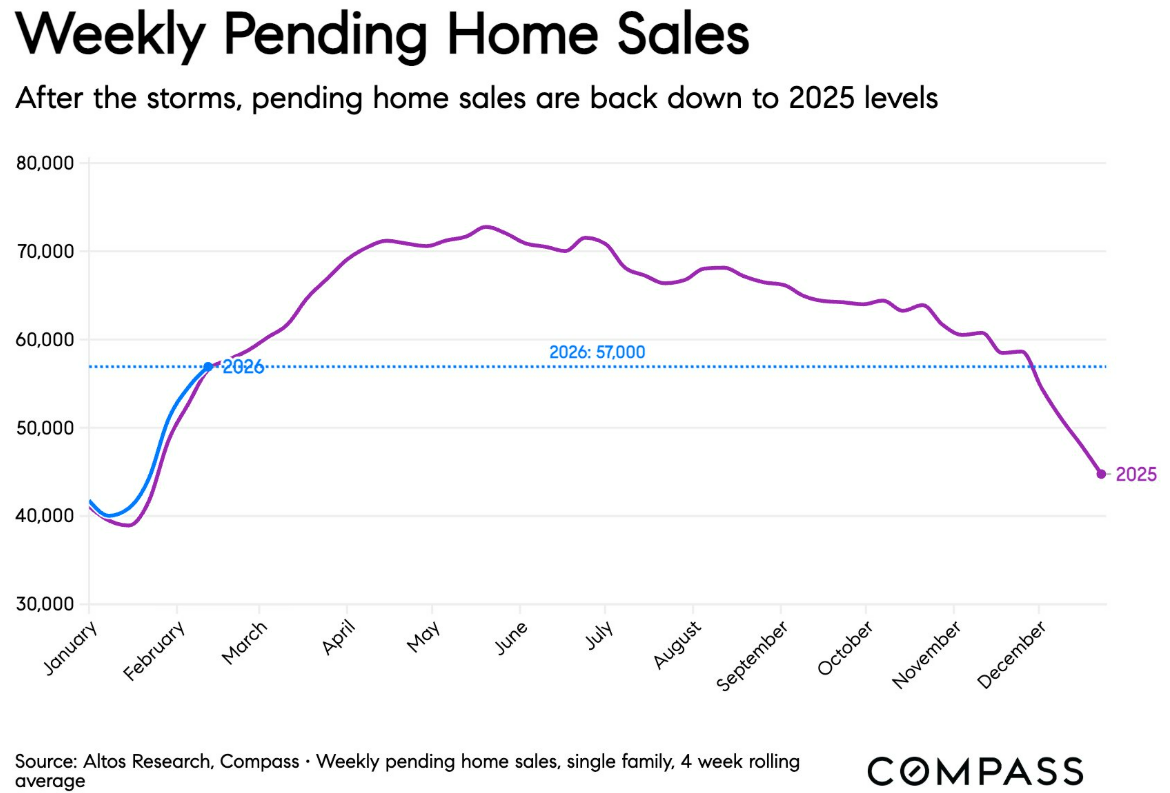
Pending contracts dipped below last year for 2nd straight week. Inventory down, new listings down, sales down. Looks bad, right? Western US (warm, dry): strong sales growth over 2025 Eastern US (buried in snow): sales below last year Looks just like the weather map Florida positive by 6%, the Southeast drag is VA, GA, NC. As the country thaws, eastern states should follow the west. 691K single family homes on market, only 8.2% above last year Prices basically flat. Median pending price $394K, +1.7% YoY. Asking price/sqft -1.6% YoY. No signal of big price movement in either direction. Sales gains in 2026 are fragile, but this dip looks like weather, not a rejection by buyers. Next few weeks will be telling.
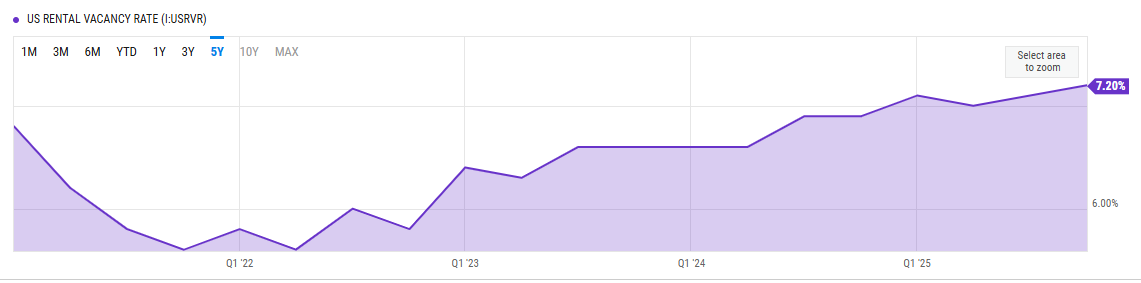
Housing Vacancy Rate: 7.2% – increasing Q4 2025
Charts below updated on Feb 28, 2026
United States Single Family Home Prices
Source: tradingeconomics.com
United States Total Housing Inventory
https://tradingeconomics.com/united-states/total-housing-inventory
Source: tradingeconomics.com
United States Existing Home Sales
https://tradingeconomics.com/united-states/existing-home-sales
Source: tradingeconomics.com
Policy Watch
Big picture items that may affect Real Estate:
– I hope to provide you with the commonly referenced, applicable financial data to see for yourself what effect government economic policy has on jobs, incomes, debt positions, and affordability for Americans, regardless of party.
— *** The jobs report is important. Please know when the gov puts out a report like "jobs", there is a revision done a month or so later, when they crunch the actual numbers. The press rarely reports the revisions, but that is the most accurate. I advise you to put less emphasis on the initial reports and look at the later revised reports for a more accurate view. They indicate part-time, full-time, native born and foreign-born, private sector and public sector job, those are categories that matter.
https://www.zerohedge.com/economics/historic-negative-jobs-revisions-1-million-fewer-jobs-added-2025-only-15000-avg-jobs
- The annual inflation rate in the US slowed to 2.4% in January 2026, its lowest level since May, down from 2.7% in each of the previous two months and below forecasts of 2.5%. The deceleration largely reflects base effects, as higher readings from a year ago drop out of the annual calculation. Price pressures eased notably in the energy sector, with prices falling 0.1%, after a 2.3% rise in December, led by gasoline (-7.5% vs -3.4%) and fuel oil (-4.2% vs 7.4%). Prices of natural also rose at a slightly slower pace (9.8% vs 10.8%). A decline was also seen in prices for used cars and trucks (-2% vs 1.6%) while inflation slowed for food (3.1% vs 2.9%) and shelter (3% vs 3.2%). On a monthly basis, the CPI rose by 0.2%, below 0.3% in December and forecasts of 0.3%. Annual core inflation eased to 2.5%, its lowest reading since March 2021, compared with 2.6% in the prior month and in line with expectations. On a monthly basis, core CPI increased by 0.3%, slightly above 0.2% in December. source: U.S. Bureau of Labor Statistics
— The BRICS nations are going to have a hard time coming off the Dollar as the U.S. actions being taken to curb spending kick in to increase stability. They’re going to try, but the consensus is odds are low.
— Please say NO to Central Bank Digital Currency (CBDC) in any form (ie Fedcoin).
– Passive income from RE is a shield for most of this, whereas "flipping" and wholesaling can stop at any time.
**** We love “co-living” for amazing cash flow. Ask us about how we can help you retire with just 5 single-family houses.
Mortgage Applications & Rates
Because the current market relies HEAVILY on the CHANGE in mortgage rates, we’ve added this section.
Key Mortgage Stats:
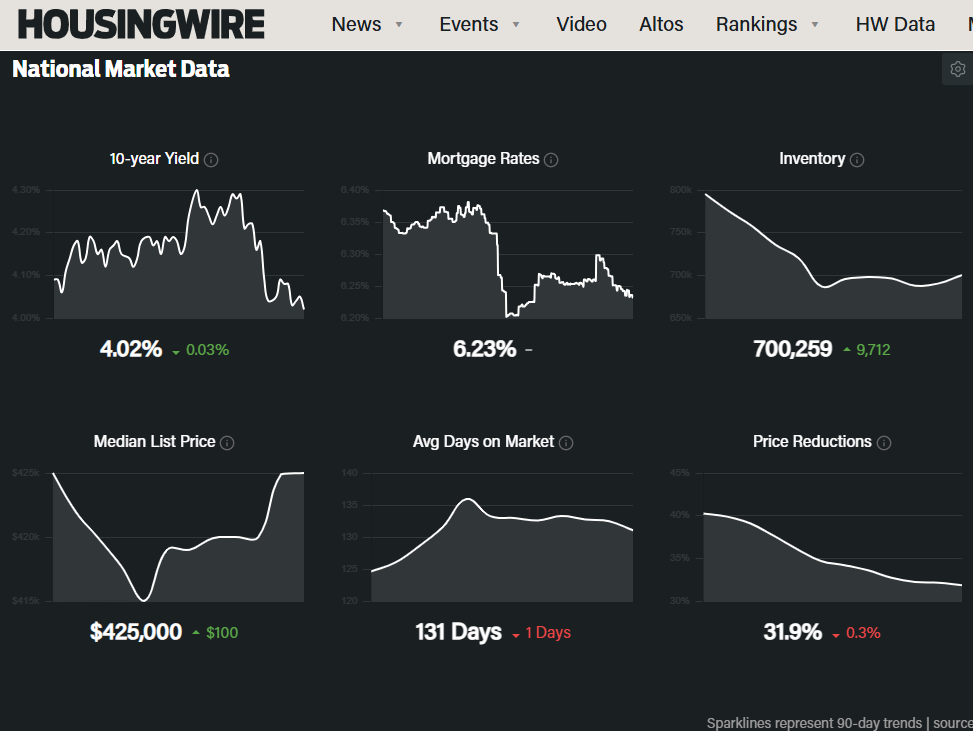
30-Year Mortgage Rate: 6.22% as of December 11th 2025 (previously 6.19%)
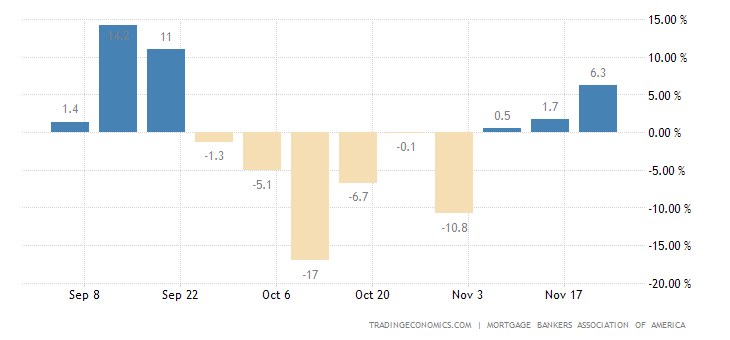
MBA Mortgage Applications: 4.8% as of December 10th 2025 (previously -1.4%)
The average rate on a 30-year fixed mortgage dropped to 5.98% as of February 26th, from 6.01% in the previous week to the softest level since September 2022, according to data from Freddie Mac. “For the first time in three and a half years, the 30-year fixed-rate mortgage dropped into the 5% range, falling even lower than last week's milestone. This rate, combined with the improving availability of homes for sale, is meaningful and will drive more potential buyers into the market for spring homebuying season,” said Sam Khater, Freddie Mac’s chief economist. source: Freddie Mac
Source: Trading Economics
The volume of mortgage applications in the US rose by inched higher by 0.4% from the previous week in the third week of February, extending the 2.8% increase in the earlier period, according to data compiled by the Mortgage Bankers Association. The improvement was slight despite the fresh plunge in benchmark mortgage rates, which hit their lowest level in nearly four years, as soft risk appetite drove investors to pile on long-dated Treasury securities this month. Demand for contracts to refinance a mortgage, which are more sensitive to short-term changes in interest rates, jumped 4%. In turn, applications for a mortgage to buy a home fell 5%, with the report reflecting insufficient new supply that drove homebuyers to sit on the sidelines.
Source: Trading Economics
United States MBA 30-Yr Mortgage Rate
Source: Trading Economics
Delinquency & Foreclosures
Understand the leading indicator of borrower stress. (It will lag behind a few weeks before the data is reported)
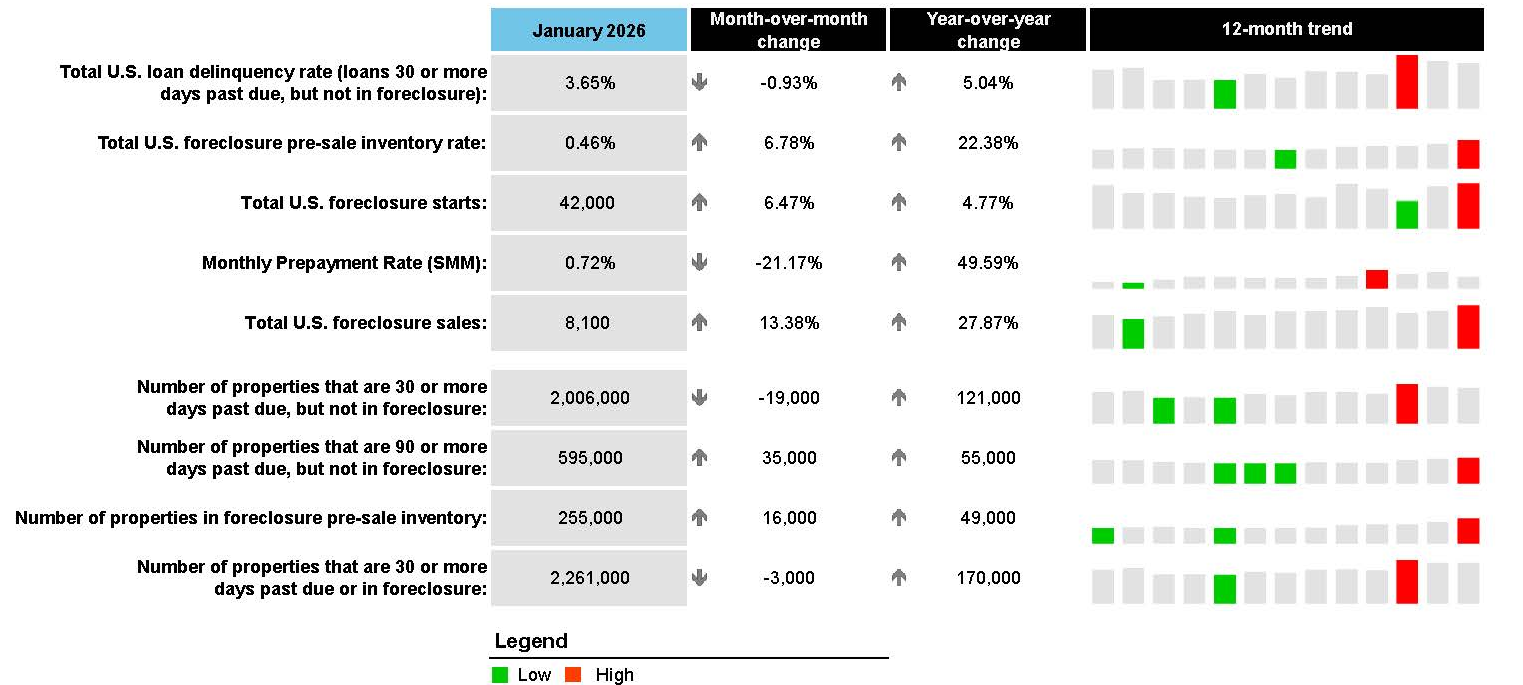
Key takeaways from this month’s findings include:
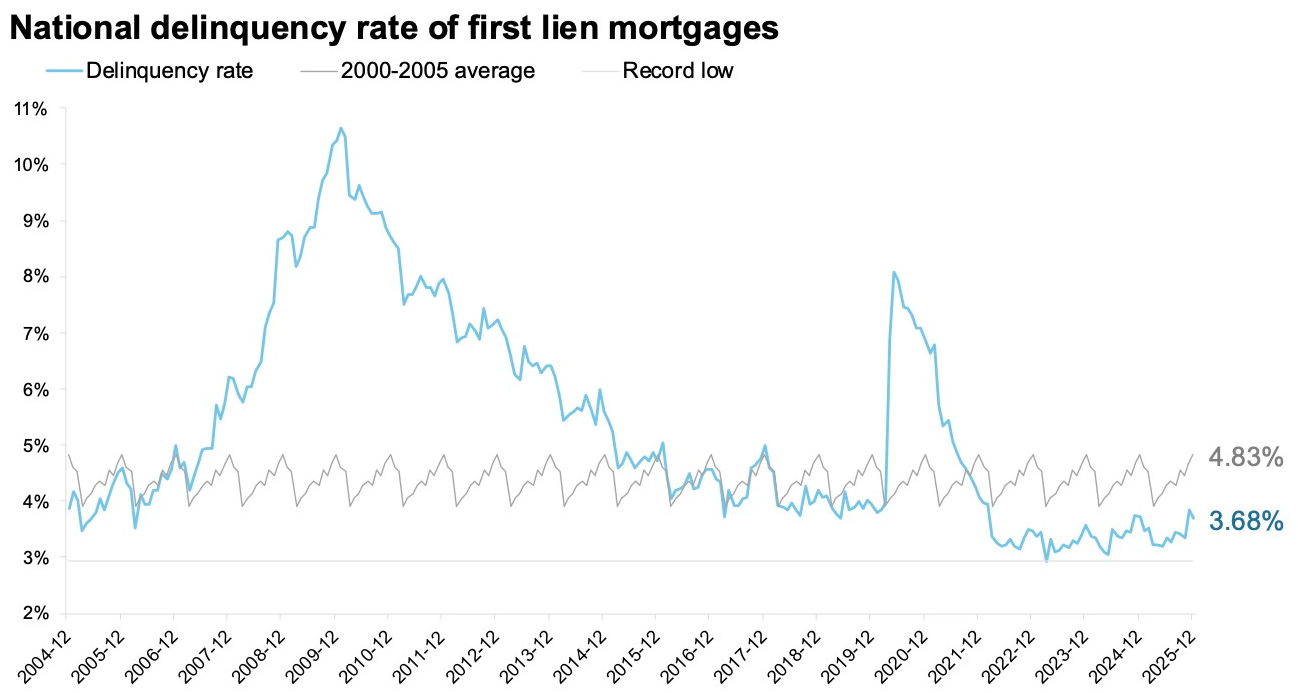
The national delinquency rate eased in January: Delinquencies fell by 3 basis points (bps) in January to 3.65% and remain 15 bps below the January 2020 pre-pandemic benchmark.
Early-stage delinquencies drove the decrease: The number of borrowers 30 or 60 days late on their mortgage payments fell by 54,000 from December to January, driving the overall improvement in delinquency figures.
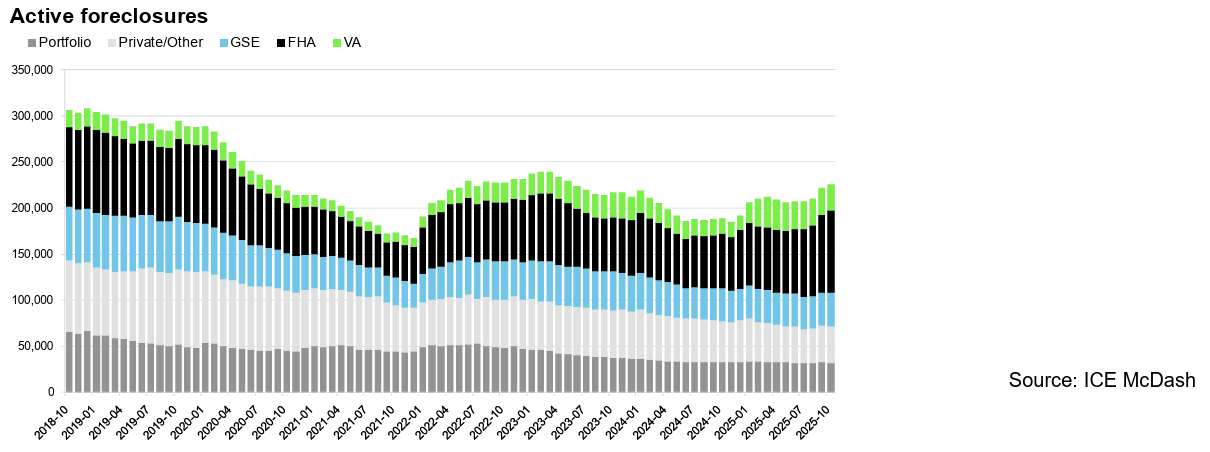
Combined serious delinquency and foreclosure volumes increased: While earlier stage delinquencies improved, there are now more than 850,000 borrowers 90-plus days past due or in active foreclosure, up 104,000 from the same time last year, the largest such volume since July 2022.
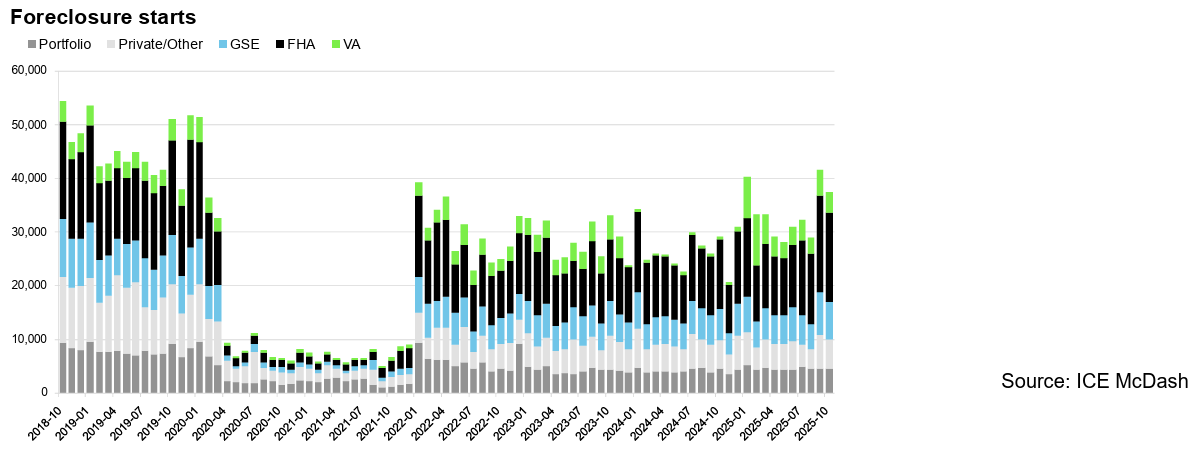
Foreclosure activity continued to rise: January saw 42,000 foreclosure starts, the highest monthly total since early 2020 and up 5% year over year, with foreclosure sales rose 28%.
Prepayments pulled back: The single month mortality (SMM) rate, which tracks prepayments, dropped 19 bps to 0.72% from elevated levels over the past three months. An uptick in interest rates in December resulted in fewer January home sales and reduced refinance activity.
For more information about gaining access to ICE’s loan-level database, please send an email to
[email protected].
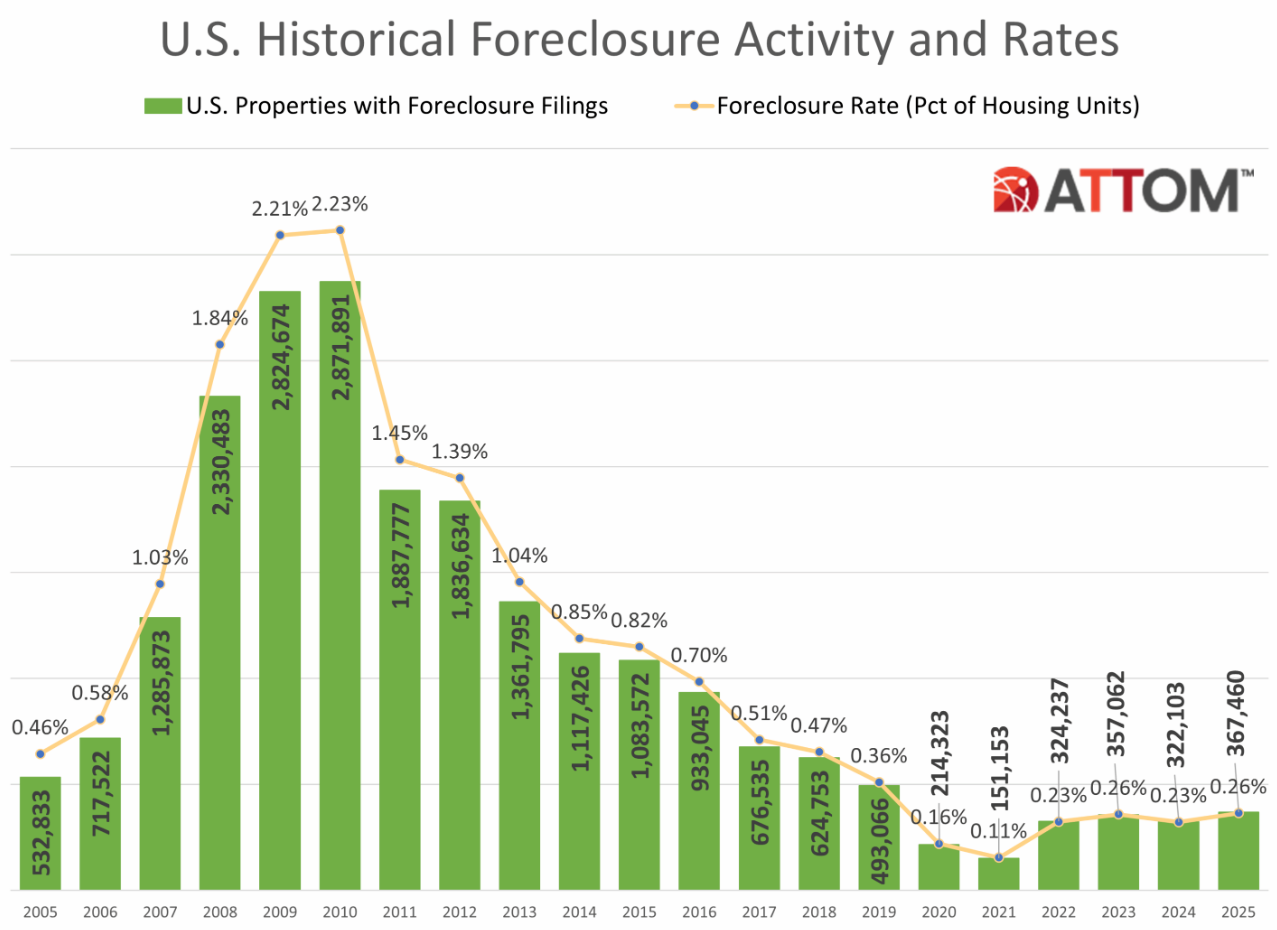
US Historical Foreclosure Activity and Rates
Transform your financial future with the Recovery Home Revolution

COMPANY
CUSTOMER CARE
LEGAL
FOLLOW US
Copyright 2026. Fidelis Wealth Builders. All Rights Reserved.